|
|
|
|
|
|
|
|
|
|
|
|
|
|
 |
|||
| D. Warner North :: Publications | |||
Analysis of Risk of Supply Interruption to Lithuania from Disruption of Natural Gas Supply from RussiaD. Warner NorthNorthWorks, Inc., Belmont CA, USA; and Department of Management Science and Engineering, Stanford University, Stanford, CA USA Paper prepared for the SEIF-IV Conference, Brussels, Belgium, November 14-16, 2005; Revised December 4, 2005. (Minor editorial changes were made when placing this paper on the web, April 2006.) Abstract
I. History and Background
The expansion of the European Union to include nations once a part of the Soviet Union provides challenges to the European political leadership, in particular, the challenge of energy planning to secure a reliable supply of energy at a reasonable cost. The energy infrastructure for the Soviet Union was built on a regional basis, with an extensive system of high-voltage transmission lines and pipelines for oil and gas transport. A main source of electric power for the western Soviet Union was the Ignalina Nuclear Power Plant (NPP), with two 1500 MW nuclear generating units of the graphite channel (RBMK-2) type, the same Soviet design as at the Chernobyl NPP in the Ukraine. Ignalina NPP became a part of Lithuania when Lithuania became an independent country. Its 3000 MW generation capacity allowed Lithuania to meet most of its own needs for electricity from this NPP and also to export large amounts of electricity to Latvia, Estonia, Belarus, and the Russian Federation.
A condition agreed to by Lithuania for becoming a full member of the European Union (EU) is that the two Ignalina units will be shut down. Unit #1 ceased to operate at the end of 2004 and is not expected to operate again. Unit #2 is planned to cease operation by the end of 2009. This unit is now rated at 1350 MW. The motivation for the closure of these nuclear units is concern over their safety, and the EU has promised financial assistance to Lithuania in making the needed transition to other energy sources. The details of this assistance are not yet worked out.
The author�s primary background and expertise is risk and decision analysis. In the 1970s the author was involved in a number of energy planning studies in the United States, including the analysis of a major Presidential initiative to create a one million barrels per day synthetic fuel capability within ten years [1,2] and a comparison of the economic and social costs of coal and nuclear generation [3]. The author also chaired the review of the first set of reports to Congress on global climate change, for the Science Advisory Board of the US Environmental Protection Agency [4]. Last October, the author substituted on short notice for his Stanford University colleague Stephen Schneider in giving a presentation on global climate alteration in Stuttgart, at a meeting organized by the Minister of Transport and Energy of the State of Baden-W�rttemberg [5]. Especially in the roundtable discussion that followed the presentations, which included leaders of German industry and representatives from the German Bundestag, the author became persuaded that formal analysis of the kind done in the United States in the 1970s would be very helpful in Europe. The role of nuclear power seemed a particularly divisive issue, as some countries (e.g., France, Finland) are heavily dependent on nuclear generation, while others (e.g., Austria, Germany, Sweden) either have discontinued use of nuclear power plants or have passed legislation that nuclear plants in these countries should be shut down. After the conference in Stuttgart the author visited Dr. Christian Kirchsteiger at the JRC in Petten, for discussion on [3] and related topics of current interest for the Institute for Energy. The result was the identification of Lithuania as a case study that might illustrate important problems for EC energy planners and associated needs for new or improved analytical tools to address these problems. The nuclear decision for Lithuania is, at least in principle, already made: Ignalina NPP is to be shut down, within five years. The issues to be addressed are how Lithuania will meet its need for energy, and in particular, electricity, in the period following the NPP shut down, and how EC should assist Lithuania, as it has agreed to do.
During the past year the author has carried out an initial exploration of these issues, first as a class exercise for a class taught winter quarter at Stanford University (MS&E 290, Public Policy Analysis), and then by making several visits to meet with leading experts at the Lithuanian Energy Institute (LEI), who have been most generous in introducing him to their country and their research activities. The main published sources are the National Strategic Plan [6], the �Energy supply options� IAEA report of 2004 [7], and the LEI Annual report of 2003 [8]. Other presentations at this SEIF-IV conference by Drs. J. Augutis [9] and A. Galinis and D. Tarvydas [10] provide additional information on LEI research and its perspective on Lithuania�s energy future.
A forecast from [6] (and [8]) of electric generation from 2002 to 2025 is shown in Figure 1. In 2002, the Ignalia NPP produced approximately 80% of Lithuania�s electricity generation, with much of the remainder coming from central heating plants (CHP) in Vilnius and Kaunas, Lithuania�s two largest cities. These plants produce both electricity and steam for regional heating use during the winter season. Beginning in 2010 when Ignalina Unit #2 is no longer available, about 8,000 GWh (gigawatt-hours) of electricity must be produced from other sources: the 1800 MW Lithuanian Thermal Power Plant (TPP), the various CHPs in Lithuania, and one or more new gas turbine combined cycle (GTCC) plants, which offer much higher thermal efficiency in producing electricity from oil or natural gas fuels. Since 1995 the Lithuanians have been experimenting with orimulsion, a mixture of water, bitumen (tar) with up to 3% sulfur and heavy metals, and surfactant. The source is Venezuela, and orimulsion has the advantage that it easily handled compared to coal: It can be transported and stored as a liquid. While it is inexpensive compared to natural gas, it requires sulfur removal via flue gas desulfurization (FGD) and particulate removal. Considerable progress has been made in adding such capability to the large Lithuanian Thermal Power Plant. 450 MW (two of eight units) are already set up so these boilers can burn orimulsion [7,11] Adding such air pollution control equipment to the CHPs may be more difficult, and orimulsion is unlikely to be feasible for gas turbines, for which clean distillate or natural gas fuel is needed to avoid erosion of turbine blades. While some heavy oil may be available from Lithuania�s refinery at Mazeikiai, it is not expected to play a large role. Similarly, the role of renewables is expected to be small in meeting the need to replace the generation when Ignalina Unit #2 shuts down. Coal is not currently used in power generation in Lithuania, although a small amount is used in households and for small boilers. Because of the need for construction of coal handling facilities and the air pollution control requirements, use of imported coal for power generation is not currently being considered in Lithuania.
The primary contenders to replace the electricity generation from Ignalina, according to [6,7], are one or more new GTCC plants, the various CHPs, and the Lithuanian TPP. The CHPs and Lithuanian TPP may need further modernization to improve efficiency and to enable the expanded use of orimulsion. If natural gas is inexpensive and reliable, greatly expanded use of this cheaper but dirty fuel may be the best option. If natural gas is more expensive and its supply judged less reliable, Lithuania may wish to use a large quality of imported orimulsion, (as indicated in [7], scenarios 1,2, pages 122-123.) Building a new nuclear plant to replace Ignalina was also considered in [7], but will not be considered in this paper.
Unless one considers building a new nuclear plant to replace Ignalina, the planning problem comes down to a greatly increased reliance on natural gas from Russia, or a smaller increase in natural gas from Russia plus importation of orimulsion from Venezuela, and the modernization of power plants and perhaps adding new ones with higher efficiency in converting fossil fuel into electricity. Two points from the National Energy Strategy should be emphasized because of the events that have occurred since this document was prepared in 2002. First, the large increase for world crude oil (currently at about $60 per barrel for Brent Crude), and natural gas prices set in world markets through competition with oil, imply that Lithuania faces a major economic burden in converting from the cheap nuclear electricity from Ignalina to electricity from alternative sources. Lithuania is a small country, and it will require considerable financial help. �The early closure of the Ignalina NPP without the required financing from the European Union and international financial institutions would become an unbearable burden on the economy of the country.� ([6], page 10.)
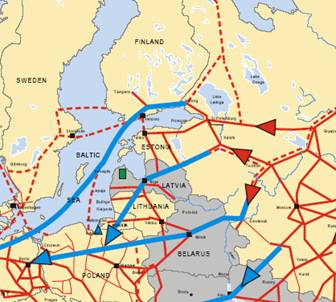
Second, even with and more so without the use of orimulsion, Lithuania is dependent on its natural gas from one supplier country, Russia, and through one pipeline. �A transit gas pipeline from Russia to Western Europe, if constructed across the territory of the country [Lithuania] would highly increase the strategic reliability of supply.� ([6], page 9.) Much to the disappointment of Lithuania and its neighbors such as Latvia, Estonia, and Poland, the decision taken in September, 2005 by Russia and Germany, to proceed with construction of a natural gas pipeline under the Baltic Sea from Russia to Germany, essentially precludes construction of a natural gas pipeline on the overland �Amber� route through Latvia and Lithuania. The �Amber� route or construction of a second pipeline on the route of the existing Yamal route through Belarus to Poland would have provided a redundant pathway for Russian natural gas into Eastern Europe.
II. Natural Gas Supply: Economics and Politics.
The European Commission Green Paper on energy security of 2000 [12] highlights the problems illustrated by the quote above from page 9 of the Lithuanian National Energy Strategy [6]: �Indeed, a number of Member States, and in particular the applicant countries, are entirely dependent on a single gas pipeline that links them to a single supplier country.� ([12], page. 25.) �The challenges posed by the transit problem have also been significantly complicated by the emergence of the New Independent States (NIS) out of the ruins of the Soviet Union.� ([12], page 26.) �It is essential for the [European] Union to maintain satisfactory relations with the transit countries if it is to have stable access to the energy products it needs. This is especially true for gas, where the main risk lies in transit conditions and continuing diversification of transport routes, not in the status of world reserves.� ([12], page 26).
It is not clear that much progress has been made in developing policies or analytical tools in support of policy making to deal with the insecurity of natural gas supply from Russian through a single pipeline to Lithuania, and similar dependence for other countries in Eastern Europe. A search through documents on the European Commission website provides indications that others who have looked at the security of gas supply more recently have reached similar conclusions. "� it is obvious that political destabilization in Russia, or economic uncertainty, could trigger a supply shortfall in future supplies.� ([13], page 60). Keith C. Smith, the former American Ambassador to Lithuania, has recently written a report [14] on Russian energy politics and its influence in Eastern Europe. His paper [15] for the SIEF-IV Conference should provide important perspective on these determinants of the security of gas supply from Russia.
In April of 2004 the supply of natural gas to Belarus was curtailed after the Belarus government failed to pay its bill for the Russian gas. Since Lithuania obtains its gas from the pipeline through Belarus, it found that its gas supply was cut off. An emergency arrangement, transporting gas though an existing but unused pipeline through Latvia, was carried out despite the absence of metering equipment on the border between Lithuania and Latvia. In this way the impacts of a shortfall in Lithuania were reduced. Lithuania and Poland both asked Russia for compensation to their economies. Gazprom, supported by the Russian government, denied these requests. ([14]). This incident points out that Russia can shut off a gas pipeline, and Lithuanians are understandably concerned that this could happen again. The positive side is that natural gas from Russia is an excellent alternative to meet Lithuania�s needs, especially in the post-Ignalina shutdown period. The reasoning is set forth in the National Energy Strategy, [6], page 32: Technically and ecologically, natural gas is the most effective fossil fuel with its vast world reserves. Taking into consideration the large resources of Russia�s gas fields, the routes of and trends in their export to the West, the existing technical supply facilities and the ever more stringent environmental requirements, natural gas in Lithuania is the most promising kind of fossil fuel during the whole period under review.
This same viewpoint holds true for Europe as a whole. Increased use of gas from the large supplies in Russia can provide ample amounts of clean fossil fuel to replace the depleting gas supplies from the North Sea, and provide Europe with an energy supply that can help bridge a transition to new and improved forms of energy from renewables or from nuclear power, possibly including fusion, in the latter portion of the 21st century. Natural gas contributes much less carbon dioxide per unit of energy than coal or oil.
This author�s working hypothesis is that the risk of potential interruption in natural gas supply to Lithuania is one of the most important areas for Lithuania�s energy planning for the period after the planned shutdown of Ignalina Unit #2 in 2010. As long as Ignalina is still operating, then Lithuania�s dependence on natural gas imported from Russia is much reduced. But after the nuclear generation ceases, then Lithuania�s electricity supply, as well as other aspects of its energy infrastructure, will depend of natural gas, with perhaps some modest reduction from use of orimulsion and heavy fuel oil. There as yet is no intertie with Poland and the Western European electricity grid, and undersea connection to the Nordic countries (via a �Baltic Ring�) is also still in the planning stage. Both interconnections will be expensive, and it is not clear that these interconnections will be of sufficient capacity to be able to provide enough electricity to make up for a large shortfall in generation in Lithuania.
Natural gas is not as easily stored as oil, and Lithuania does not yet have an underground storage facility for natural gas. Western Latvia has favorable geology for even larger underground storage. A proposed storage project in Latvia is shown in Figure 2, and underground gas storage projects for Lithuania, Latvia, and Poland are shown among the DG-TREN Trans-European energy projects [16], page 34-35. This document states, �Gas stocks need to be assured for at least 60 days of normal use.� That will be a difficult requirement to meet in the period after the Ignalina Unit #2 shutdown. Another possible addition is another natural gas pipeline. Adding metering equipment to the pipeline in Latvia would seem like excellent insurance in case there is another interruption in supply through the pipeline through Belarus. An improved pipeline to Kaliningrad is advocated in the National Energy Strategy ([6], page 33). If a spur pipeline were run from the Baltic undersea pipeline to Poland (see dotted line in Figure 2) or Kaliningrad and then into Lithuania, and this line were built at sufficient size, then gas from the new Baltic pipeline from Russia could be moved eastward into Lithuania to assure adequate supply, in case of an interruption of supply through the pipelines to the east of Lithuania. A large two-way pipeline link through Kaliningrad might improve the security of gas supply to Latvia and to other neighboring countries as well.
What are the main threats to the adequacy of natural gas supply to meet demand? Four categories of such threats might be examined. First, unusual weather such as a prolonged period of extreme cold can lead to increased demand, exceeding available supply, or weather-related equipment failures. Most electric and gas utilities plan for extreme weather, but occasionally shortfalls occur. There have been many examples in the United States, most recently, the impact of Hurricanes Katrina and Rita on the Gulf Coast. Second, equipment failures can occur in the absence of severe weather. Such failures become more likely if equipment is not appropriately upgraded and maintained. Compressor stations can fail and gas pipelines can corrode. Third, acts of terrorism or sabotage can lead to loss of facilities. Such actions have become a worldwide concern, and recent events in Russia have demonstrated the ability of terrorists to carry out well planned and sophisticated attacks on schools, airplanes, and police stations. So far there have not been efforts to attack energy infrastructure in Russia. Fourth, supply can be deliberatively interrupted for economic or political reasons -- as happened to Belarus, and Lithuania, in April of 2004.
Investment in increased gas storage and in additional pipelines can lead to a more robust and secure supply system for natural gas from Russia to meet the needs in Lithuania and other nations of the EU. It is an urgent need for Lithuania, and Lithuania has been promised financial assistance. What configuration of storage and gas transmission lines represents the best investment in achieving adequate security of supply? These projects to construct new pipelines and storage facilities are very expensive, at the level of tens of millions of euros for storage projects to the order of 6 billion euros for the Baltic Undersea natural gas pipeline [16]. What institutional arrangements between EU countries including Lithuania and its New Independent State neighbors (using the language cited above from the Green Paper) are needed to assure that Russia will not unreasonably interrupt supply or charge unreasonably high prices for its gas? These seem like very important issues for the EC to address, and in our review we have not come up with much evidence that the EC energy research centers are addressing these issues with modern analytical tools. We now turn our attention to describing such tools.
III. Analytical Tools Area #1 � Probabilistic Risk Analysis.
A shortfall or failure in a complex system often can be described as a scenario, a set of events leading to this failure. Probabilistic models of such event sequences have a long history in statistics and reliability theory. Such approaches were developed in the aerospace and nuclear power industries and then widely applied in these industries and elsewhere. Decision analysis evolved out of statistical decision theory in the aftermath of World War II. In decision analysis, sequences are examined of decisions and uncertain events. A decision tree is often used as a visual display and as a computing device for computing the probability distributions corresponding to different decision alternatives, and then evaluating these to find the best decision [17].
Influence diagrams evolved from decision trees to deal with situations in which a sequence of events occurs, with a complex structure of conditionality. For example, a series of ten to twenty uncertain events precedes the system failure of interest, and the probabilities assigned to one of these events may depend on some (say, 2 to 6), but not all of the preceding events in the sequence. With binary events, a sequence of ten events leads to a thousand end points or scenarios, and 20 leads to a million. An illustration of such an event tree showing all the possible outcomes becomes impractical. The influence diagram is a schematic form that shows by means of arrows connecting nodes the conditionality structure. The basic idea was developed by Allen C. Miller and colleagues in a military application and first published in unclassified form in [18]. It has achieved widespread use in decision analysis, operations research [19] reliability [20] and also in computer science applications, sometimes under the term, Bayesian nets. A recent application to terrorism by the author�s department chairman at Stanford and one of her students is found in [21]. Software packages for influence diagram computations are available from several sources. For the illustrative example below, the author has used Decision Advisor, a propriety software package for R&D management marketed by SmartOrg of Menlo Park, CA.
We described above that failure of the natural gas supply system to meet gas demand might result from four types of events:
The arrows show conditionality for dependence of the uncertain events on preceding events. For example, we assume that a failure of the system to meet peak demands as the result of extreme weather depends on whether the extreme weather occurs (and perhaps to what extent) and on the configuration of the pipeline and storage system. An analysis might consider a base case and several alternatives in which additional investment has been made to have storage facilities and one or more additional pipelines from the supplier country. For each system configuration and each of the weather outcomes, a probability is assigned to each of the cases for a supply shortfall. We show below in Figure 4 a decision tree representation: two outcomes for extreme weather (yes and no), three systems configurations (base and two alternatives) and two possibilities for shortfall (shortage and none).
Obviously, this example is extremely simplified. The approach is capable of using a much more complex structure of conditional events represented as nodes in the influence diagram. For the other three terms, we have conditioned equipment failure only on the configuration decision, and we condition �terrorist attack� on �supplier political evolution.� �Deliberate flow restriction� is also conditioned on what happens in �supplier political evolution.� This node is intended to describe what might happen politically in Russia during the next 5-15 years, and perhaps in neighboring countries like Belarus as well. A very simple characterization of three mutually exclusive, collectively exhaustive outcomes might be: continued steady progress in democracy, protracted civil unrest, and reversion to authoritarian imperialism. Probabilities are assigned to each of these outcomes, based on the judgment of experts in the politics of the area. Disagreement among such experts can be expected. Which judgments are most important? Sensitivity analysis can help determine which judgments are most important.
Moving from left to right and then down the influence diagram, probabilities are assigned to �terrorist attack,� conditional on which of these outcomes occurs and the system configuration alterative. �Deliberate flow restriction� is shown conditioned only on �supplier political evolution.�
Once the set of conditional probability assignments are complete and outcomes for �unmet demand� resulting from the four sets of causes are described, then the software can compute probability distributions for each configuration, so that costs and risks of supply interruptions of different time periods and regional impact magnitudes can be compared. An illustrative cumulative distribution is shown below in Figure 5. It shows a moderate probability (about 7%) of a limited shortfall judged to be worth about
� 1 billion, and a much smaller probability (0.7 %) of a much larger shortfall, valued at
� 60 billion. Such a disaster would be comparable to the impacts the US is currently experiencing from the Gulf Coast hurricanes. It might plausibly result from a major, extended interruption in Russian gas, perhaps from a series of successful terrorist attacks, civil unrest, or an extreme action, or series of actions by the Russian leadership to reduce supply to European countries.
Reference [21] describes an application of influence diagrams at a much more sophisticated level of complexity. The structure shown here is intended only as a highly simplistic description of the methodology, for those not familiar with influence diagrams and probabilistic risk analysis. Applications of probabilistic risk analysis to weather and equipment failure are widely carried out by gas and electric utilities. Application to the threat posed by terrorism and political decisions to interrupt supply are not widely practiced. It may be useful to carry out such an analysis as the basis for dialogue among the concerned parties. For example, some parties in Russia may assert that the threat of terrorist attack in Lithuania and other Baltic countries led to a preference for the Baltic Undersea pipeline route over a cheaper overland route.
IV. Analytical Tools Area #2: Energy Models for Long-range Planning
Planning the future of a complex energy system on a time scale of many decades is a daunting challenge. Dating back at least to period in the 1970s when the United States was considering large investments in new energy systems, such computer planning models are increasingly being used by businesses and government agencies. The analysis in [7] involves the use of linear programming, which has been widely applied in the US and internationally.
Stanford University has since the 1970s had an activity called the Energy Modeling Forum, in which leaders in the field of energy modeling bring their models (often proprietary computer software, developed at considerable investment expense) and come together to analyze case exercises, from regional planning to global response in the context of global climate change. Reference [22] is a report on dealing with natural gas supply in North America. One of the models used in the exercise described in [22], the North American Gas Model (NARG), is a direct descendent of the SRI-Gulf model used for the synthetic fuel commercialization analysis described in [1] and [2]. In [22] this model is being used on behalf of the California Energy Commission; it has also been used for many leading US and international oil and gas companies. The lead modeler, Dale Nesbitt, worked with the author on the 1975 synthetic fuel analysis ([1] and [2]). The generalized equilibrium methodology involves an extension from mathematical programming to finding the fixed point solution x to an equation f(x) = x, where x is a vector of very high dimensionality describing flow quantities and prices of energy materials at different locations in a network connecting energy resources in the ground to energy end use demands, and at different time points from the beginning to the end of the planning horizon [23,24]. The NARG model and its European counterpart, the European Gas Model, are not unique to one vendor. Argonne National Laboratory (ANL) and Rice University have developed similar models based on the generalized equilibrium approach.
The author takes the position that an understanding of the European energy system, over a period from five to fifteen, perhaps as much as fifty years into the future, will require the use of advanced energy modeling tools. Energy models are particularly useful for projecting changes as energy prices and the availability of energy technologies change over time. The models can also be used to analyze upset conditions, such as those currently prevailing in the US, with numerous refineries and many gas production and processing facilities temporarily out of service because of hurricane damage.
V. Conclusions and Recommendations
The 1975 analysis [1,2] of the US decision on investing billions of dollars to create a million-barrel-per-day industry to make gas and liquid fuels from coal and oil shale showed this investment was a poor idea. It was voted down by Congress under the Ford Administration, but then established under the succeeding Carter Administration. It failed badly, for reasons that were foreseen in the analysis: The increased prices of oil and other energy materials that occurred in the mid-1970s led to reduction in demand and expansion of conventional oil and gas supplies, with the result that there was no market for high-cost synthetic fuel made from shale and coal.
The analytic tools used for the analysis ([1] and [2]) included a decision tree describing important uncertainties and how future decisions to expand capacity would depend on the immediate decisions to be taken in the mid-1970s. About three thousand scenarios were represented in the decision tree, and across this large number of scenarios (with some approximations via curve fitting) an energy model was used to assess how prices, technology choices, and energy quantities might evolve for that scenario.
Such tools should be very valuable in helping to understand Lithuania�s energy future and the decisions facing Lithuania, the EU, and other organizations that must help Lithuania to finance its transition away from using the inexpensive nuclear electricity from Ignalina. It is the author�s impression that the Lithuanian Energy Institute is relatively sophisticated in the use of energy modeling and probabilistic risk assessment. The author is not aware of analysis on behalf of the EU or the EC where such tools are being used, for example, to assist on decisions for determining which alternative pipeline routes should be selected. It is the author�s impression that selection of the Baltic Undersea route over the Amber and Yamal-II routes was a bilateral decision by Russia and Germany. Many other countries, including Lithuania, Latvia, and Poland have expressed considerable unhappiness over this decision and the way it was made. There was no analysis made transparent through extensive publicly available documentation to inform discussion, debate, and analysis of the alternative pipeline routes. As one who has invested much time in considering how decision analysis can assist difficult decisions on public policy [25,26], this author must recommend that the staff of the EC needs to improve the extent to which it can assist senior policy makers such as the leader of DG-TREN in making decisions affecting the security of Europe�s energy supply � particularly natural gas supply from Russia.
In the Preface to the National Energy Strategy ([6], page 5), the LEI Director at that time, Professor Jurgis Vilemas, stated, �Decision-making will hopefully, in the end, be based on economic reasoning, realistic demand forecasts and the latest achievements in development of energy generation technology.� This is an excellent place to start. I believe that Professor Vilemas and his LEI colleagues have also concluded that the reasoning should be broadened from a focus on purely economic reasoning to include the four types of risk issues that have been listed in this paper and illustrated in the simple influence diagram: extreme weather, equipment failure, terrorism and sabotage, and political interference in energy trade. I hope the SEIF-IV participants and the management of DG-TREN will endorse this expanded view on what needs to be done to support good decision making, both in Lithuania and for the EU, of which Lithuania is now a member.
References
[1]. Synfuels Interagency Task Force, Recommendations for a Synthetic Fuels Commercialization Program, report prepared for the President�s Energy Resources Council, November 1975, Washington, DC: US Government Printing Office.
[2]. S. N. Tani, �Decision Analysis of the Synthetic Fuels Commercialization Program,� The Principles and Applications of Decision Analysis, Menlo Park, CA: Strategic Decisions Group, 1989.
[3]. Stephen M. Barrager, Bruce R. Judd, and D. Warner North, The Economic and Social Costs of Coal and Nuclear Generation, Report Prepared for the National Science Foundation by Stanford Research Institute, Menlo Park, CA, March 1976.
[4]. D. Warner North, �EPA�s Draft Reports to Congress on Global Warming: An Overview from 1990.�.
[5]. D. Warner North and Stephen H. Schneider, �Global Climate Change: A Survey of the Science and Policy Implications,� in press for conference report publication, 2006.
[6]. J. Vilemas, V. Mi�kinis, and A. Galinis, National Energy Strategy, Prepared for, and approved by, the Seimas (Lithuanian Parliament) on 10 October 2002, Lithuanian Energy Institute, 2003.
[7]. Energy Supply Options for Lithuania, International Atomic Energy Agency, IAEA-TECDOC-1408, September 2004.
[8]. Lithuanian Energy Institute, Annual Report 2003.
[9]. Juozas Augutis, "Lithuanian Power Network Reliability Analysis,� paper presented at the SEIF-IV Conference, Brussels, November 2005.
[10]. Arvydas Galinis and Dalius Tarvydas, �Power Systems Planning for Lithuania and the Baltic Region,� paper presented at the SEIF-IV Conference, Brussels, November 2005.
[11]. Environmental and Related Technical Upgrading of Lithuanian Power Plant, Lithuanian Energy Institute, Addendum to 2003 EIA, 22 July 2004.
[12]. Green Paper, Towards a European strategy for the security of energy supply, European Commission, November 2000.
[13]. Study of Energy Supply Security and Geopolitics, carried out for the EC/DG-TREN, by the Clingendael International Energy Programme, January 2004.
[14]. Keith Smith, Russian Energy Politics in the Baltics, Poland, and Ukraine, Center for Strategic and International Studies, Washington, D.C., December 2004.
[15]. Keith Smith, �Political Issues Arising from Central European Dependency on Russia,� paper presented at the SEIF-IV Conference, Brussels, November 2005.
[16]. Trans-European Energy Networks, DG-TREN, European Commission, 10 June 2004.
[17]. Robert T. Clemen, Making Hard Decisions: An Introduction to Decision Analysis, Belmont, CA: Duxbury Press, 1991.
[18]. Allen C. Miller, Miley W. Merkhofer, and Ronald A. Howard, Development of Automated Aids for Decision Analysis, report prepared for the Defense Advanced Research Projects Agency (DARPA) by Stanford Research Institute, May 1976.
[19]. Ross Shachter, �Evaluating Influence Diagrams,� Operations Research, 34:871-882, 1986.
[20]. Reliability and Decision Making, Richard E. Barlow, Carlo A. Clarotti, and Fabio Spizzichino, editors, London: Chapman and Hall, 1993.
[21]. Elisabeth Pat�-Cornell and Seth Guikema, �Probabilistic Modeling of Terrorist Threats: A Systems Analysis Approach to Setting Priorities Among Countermeasures,� Military Operations Research 7(4): 5-23, 2002.
[22]. Stanford Energy Modeling Forum, Natural Gas, Energy Diversity, and North American Energy Markets, report on EMF 20, Stanford University, September 2003.
[23]. Edward G. Cazalet, Generalized Equilibrium Modeling: The Methodology of the SRI-Gulf Energy Model, report prepared by Stanford Research Institute for the Federal Energy Administration, May 1977.
[24]. Horace W, Brock and Dale M. Nesbitt, Large Scale Energy Models: A Methodological Analysis, report prepared by Stanford Research institute for the National Science Foundation, May 1977.
[25]. National Research Council, Understanding Risk: Informing Decisions in a Democratic Society, Washington DC: National Academy Press, 1996.
[26]. D. Warner North and Ortwin Renn, �Decision Analytic Tools and Participatory Decision Processes,� �State of the Science� paper prepared for the National Research Council Panel on Public Participation in Environmental Assessment and Decision Making, March 2005. Available on the web through http://www7.nationalacademies.org/hdgc/Public_Participation.html, then Quickplace link to reach documents as Tab 12. (Requires sign-up but no cost to access).
|
The Author
Figure 1. Forecast of electricity generation in Lithuania (basic demand scenario). Source: [6], p. 25.
Figure 2a. Natural Gas Pipeline routes, showing Baltic Undersea, Amber, and Yamal II in descending order, large blue lines. Note: Baltic Undersea route is entirely under water from Russia to Germany.
Source: Inogate maps, http://www.inogate.org/html/maps/mapsgas.htm
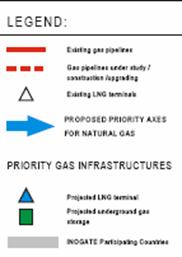
Figure 2b. Legend.
Figure 3. Influence Diagram for Lithuanian Gas Supply � Simple Illustration. Diagram produced by Decision Advisor software.
|